BradenLive
Things I write live here
BidVis
A tool for bidding on your classes
BidVis is an app I built that takes data provided by the Kellogg academic advising department and turns it into useful visualizations.
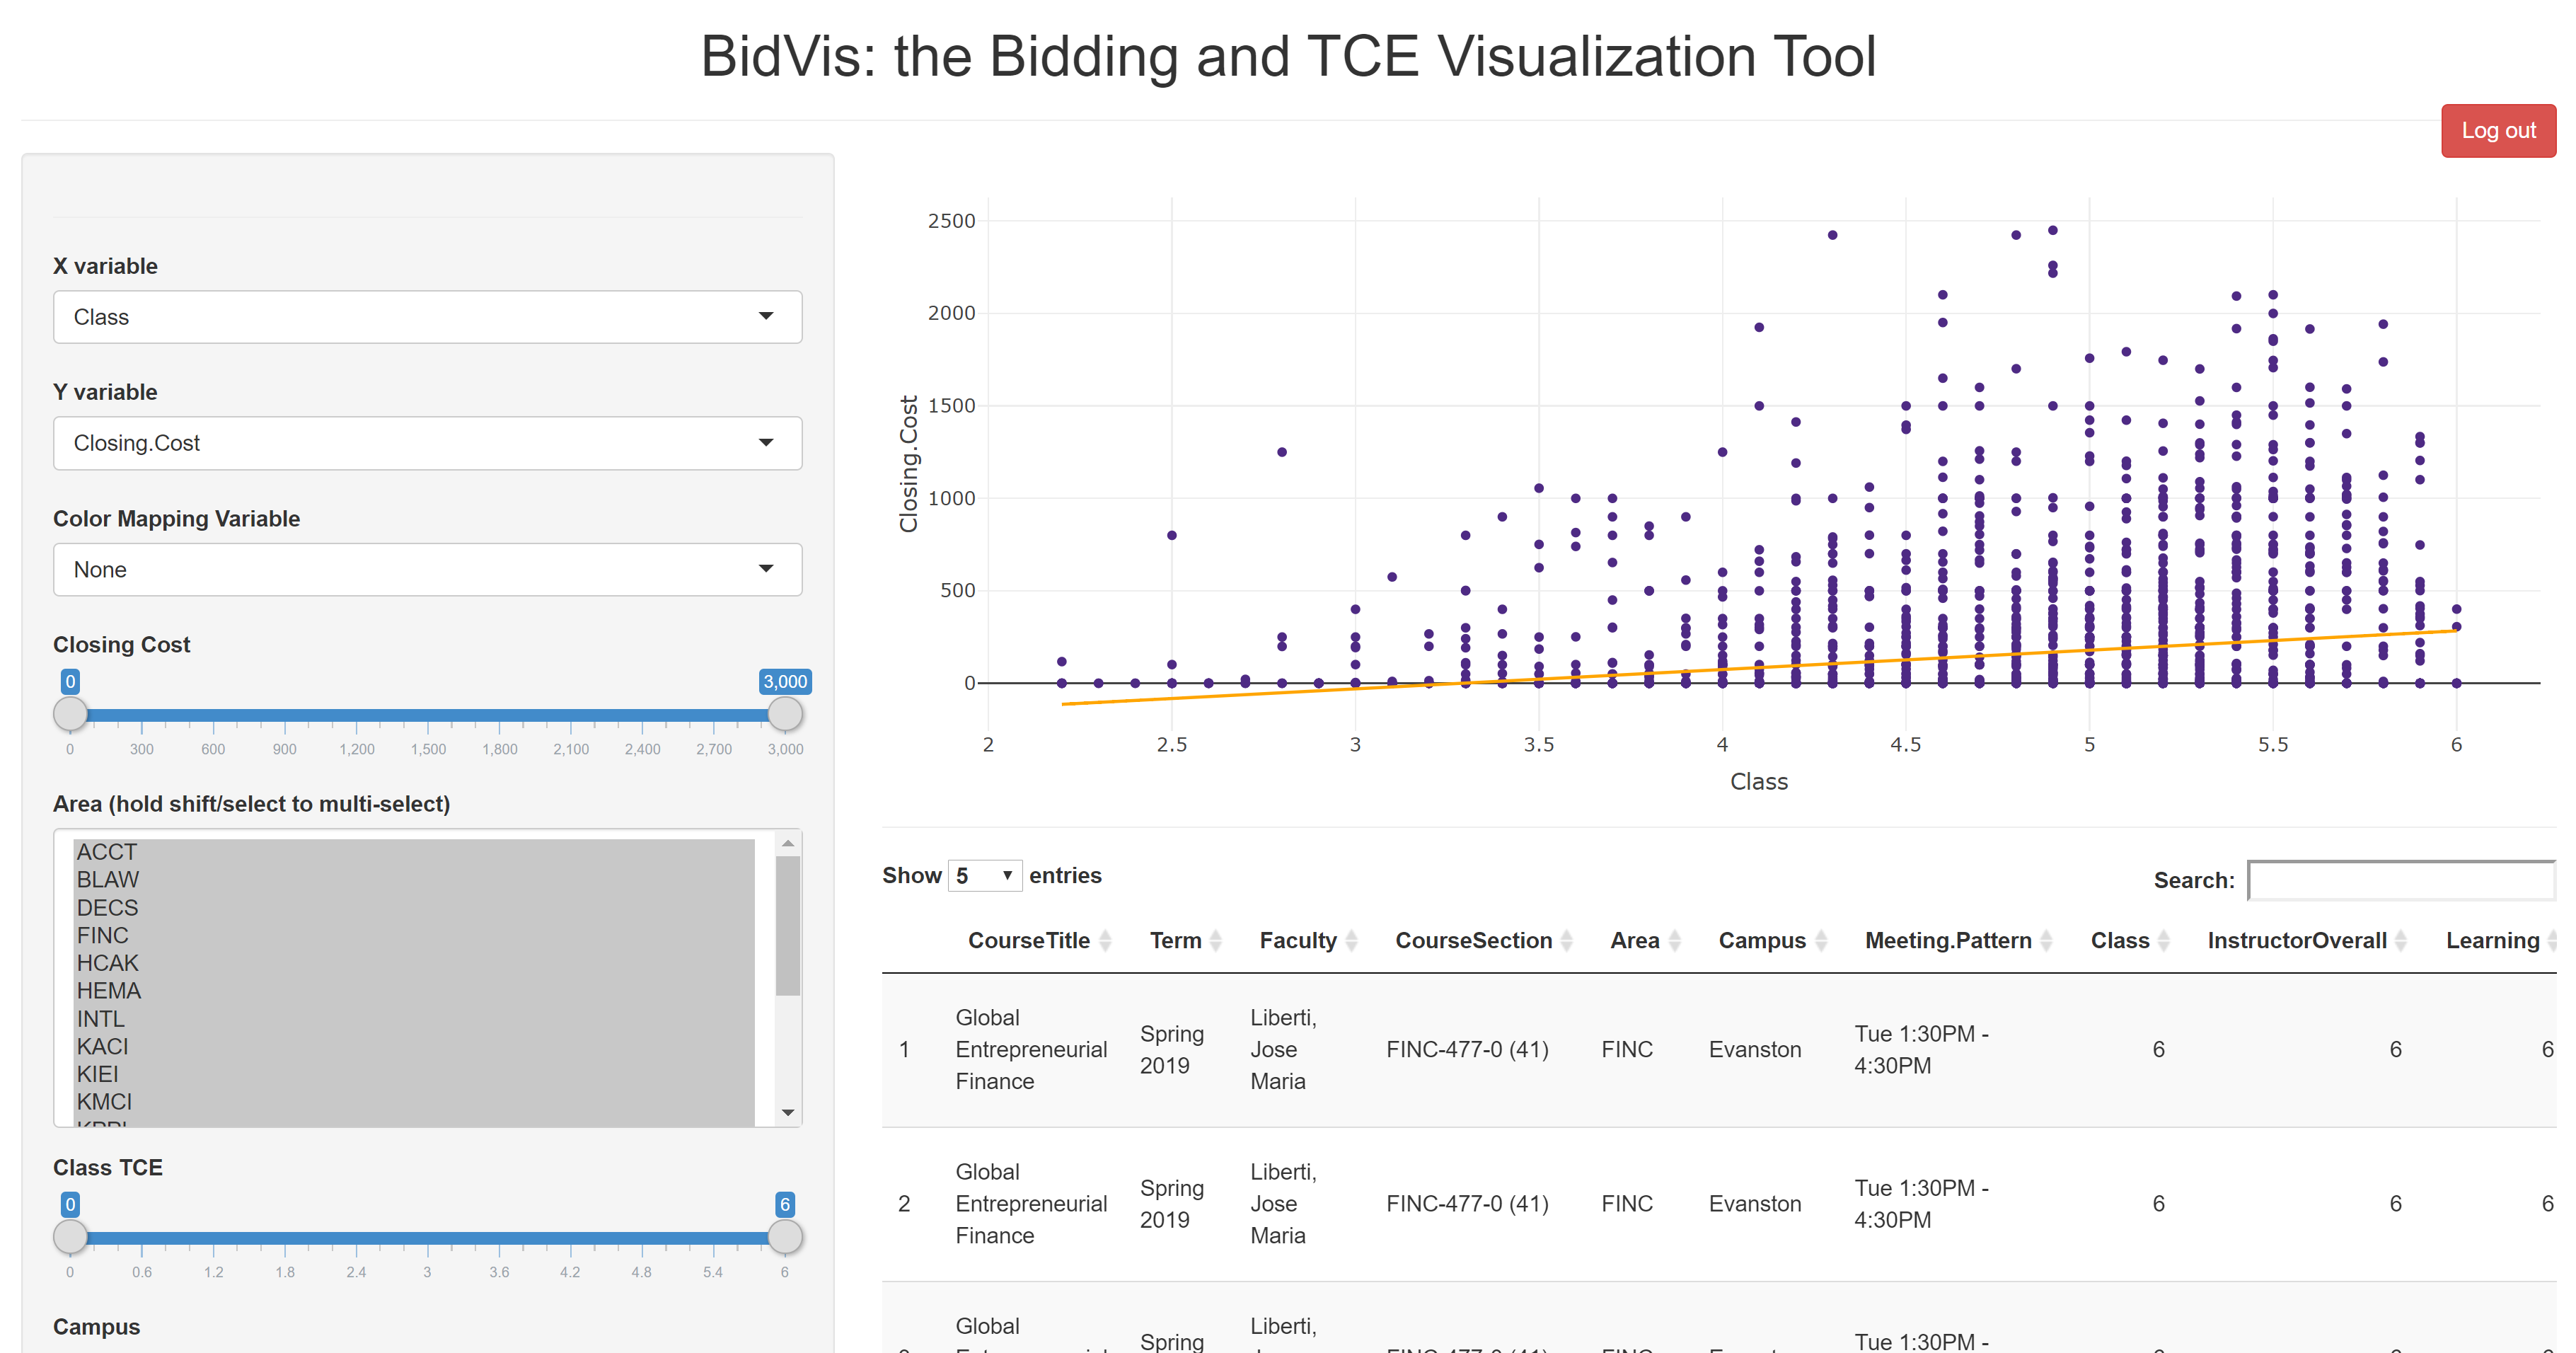
The two datasets are the Course and Teacher Evaluations (CTECs) as well as the Kellogg course bidding statistics. At Kellogg, every student is allotted a certain number of bid points which they then allocate to the various classes they’d like to take. Students are awarded a seat in the class if they bid highly enough (higher than their peers).
BidVis provides useful visualizations, sorting capabilities, and more. It is much more flexible and easy to use than the status quo solution for students before, which was downloading .csv files from the Kellogg website and then manipulating the actual data in Excel. If students get a view they like in Bidvis, they can always download the particular dataset they’ve created using the download filtered data button.
Writing this app was really fun - I learned a lot about how to clean a dataset to make it ready for production, as well as the ins and outs of hosting a web app using Rshiny.
If you’d like to test out the app to see what I built, feel free. BidVis can be accessed with the username “2y_2020” and password “braveleaders”.
Leave comments below if you have any questions or comments on how to improve BidVis!